
Refrigerant PT Charts
Every HVAC and refrigeration service call starts with the same question: what pressure should the gauge read at this temperature. These charts answer it for the five refrigerants technicians look up most, pulled from manufacturer saturation data and checked against published reference tables every year.
EPA-Certified Reclaimer
Reviewed Annually Against Manufacturer Data
Free, No Signup Required
Top 200 HFC Allowance Holder Nationwide
How to Read a Refrigerant PT Chart
What Saturation Pressure Tells You
A pressure-temperature chart tracks one specific relationship: at a given pressure, a refrigerant boils or condenses at exactly one temperature, as long as it’s sitting at saturation, meaning both liquid and vapor are present in the same space. A gauge reading on a suction line or liquid line during a service call is reporting that saturation temperature indirectly, through pressure, which is why every chart on this page runs pressure against temperature instead of some other pairing.
Superheat: Reading the Suction Line
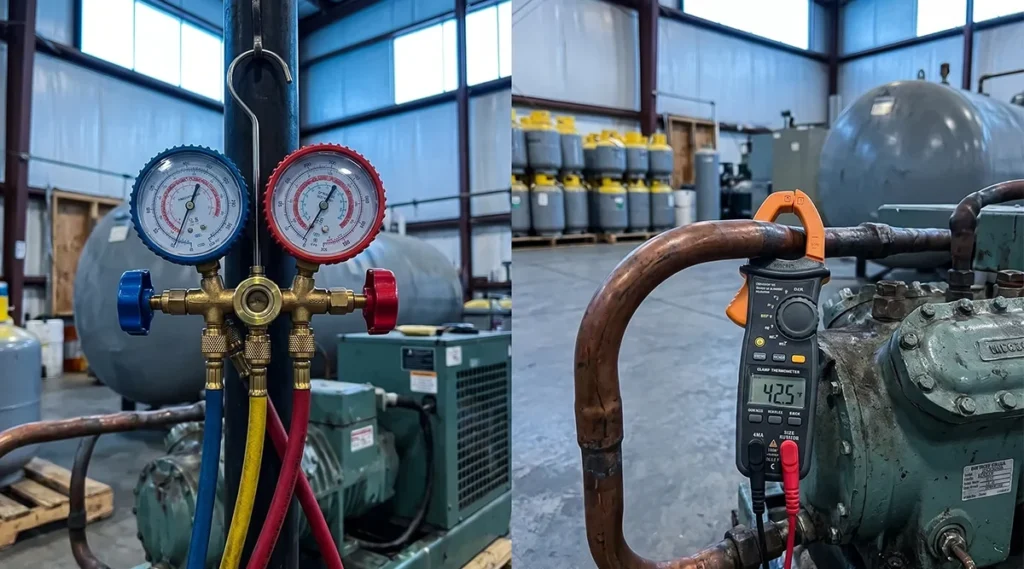
Superheat is the gap between the actual temperature of the vapor leaving the evaporator and the saturation temperature the chart shows for the current suction pressure. Read the suction pressure off the gauge, find the matching saturation temperature on the chart, then subtract that number from the actual line temperature measured with a clamp thermometer. A properly charged system holds that gap in a fairly narrow, predictable range for the metering device installed, so a superheat reading that’s drifted usually points to the charge, the metering device, or airflow across the coil, not the chart.
Subcooling: Reading the Liquid Line
Subcooling works the same way in the opposite direction, off the liquid line instead of the suction line. Read the liquid line pressure, find the matching saturation temperature on the chart, then subtract the actual liquid line temperature from that number. Subcooling shows how much the liquid has cooled below its condensing point before it reaches the metering device, and it’s the number most technicians lean on to confirm a charge on a fixed-orifice system.
Bubble Point vs. Dew Point on Blended Refrigerants
Single-compound refrigerants and near-azeotropic blends like R-22, R-410A, R-134a, and R-404A boil and condense at essentially one temperature per pressure, so one column covers the whole chart. Zeotropic blends with real temperature glide, like R-454B, don’t: the liquid finishes boiling, or starts condensing, at a slightly different temperature than the vapor does at the same pressure. Bubble point is the liquid-side number, used for subcooling on the liquid line. Dew point is the vapor-side number, used for superheat on the suction line. Mixing them up on a glide refrigerant throws off both readings, per ASHRAE safety classification standards for refrigerant behavior, which is why the R-454B table below lists both.
Common PT Chart Reading Mistakes
Three mistakes account for most bad readings pulled off a PT chart. First, reading suction pressure but pulling the saturation temperature off a different refrigerant’s chart, easy to do when running an unmarked cylinder or an older system where the sticker has worn off. Second, taking a static pressure reading with the system off and comparing it to an operating chart meant for a running system; static pressure only confirms refrigerant type and rough ambient temperature, not charge. Third, on a glide blend like R-454B, grabbing the bubble point number when the job calls for dew point, or the reverse, which throws off superheat or subcooling by several degrees even though the pressure reading itself was accurate.
Not Sure Which Refrigerant You're Working With
Check the equipment nameplate first, every unit lists its factory refrigerant charge, and that’s always the authoritative source over a cylinder color or a guess. If the nameplate is gone and you’re working from a cylinder instead, many manufacturers color-code virgin cylinders differently by refrigerant, and R-454B ships in cylinders marked A2L per federal labeling requirements since it’s mildly flammable. Absent both, running a static pressure reading against ambient temperature on more than one chart at once will usually narrow it down to a single refrigerant within a few PSI.
Look Up Any Refrigerant
Jump to a chart below, or scroll through all five. Every table runs from -20°F to 120°F in 10-degree steps, the range that covers the large majority of field service calls.
R-22 Pressure-Temperature Chart
Millions of residential and light commercial systems built before the shift to R-410A still run on R-22, an ASHRAE A1 refrigerant: nonflammable, lower toxicity, and still the most requested chart on this page by search volume.
American Refrigerants keeps virgin and reclaimed R-22 in stock for exactly this kind of service call.
| Temp (°F) | Pressure (PSIG) |
|---|---|
| -20 | 10.2 |
| -10 | 16.5 |
| 0 | 24.0 |
| 10 | 32.8 |
| 20 | 43.1 |
| 30 | 55.0 |
| 40 | 68.6 |
| 50 | 84.1 |
| 60 | 101.6 |
| 70 | 121.4 |
| 80 | 143.6 |
| 90 | 168.4 |
| 100 | 195.9 |
| 110 | 226.4 |
| 120 | 260.0 |
R-410A Pressure-Temperature Chart
R-410A replaced R-22 as the standard charge in new residential and light commercial AC systems, and it runs at meaningfully higher pressure across the same temperature range, roughly 50 to 70 percent higher than R-22 depending where on the chart you’re reading. That difference is exactly why R-22-era gauges, hoses, and recovery equipment aren’t rated for R-410A.
American Refrigerants stocks R-410A in the cylinder sizes contractors actually order, virgin or reclaimed, whether it’s a single service call or a full new-construction schedule.
| Temp (°F) | Pressure (PSIG) |
|---|---|
| -20 | 26.3 |
| -10 | 36.5 |
| 0 | 48.4 |
| 10 | 62.4 |
| 20 | 78.7 |
| 30 | 97.4 |
| 40 | 118.8 |
| 50 | 143.2 |
| 60 | 170.7 |
| 70 | 201.8 |
| 80 | 236.5 |
| 90 | 275.4 |
| 100 | 318.5 |
| 110 | 366.8 |
| 120 | 419.4 |
R-134a Pressure-Temperature Chart
Automotive AC systems, light commercial refrigeration, and a handful of older chillers still lean on R-134a, an ASHRAE A1 refrigerant that reads noticeably lower pressure than R-410A at the same temperature, one of the first things worth checking if a gauge reading looks off mid-service call.
American Refrigerants supplies R-134a for both the automotive side and light commercial refrigeration jobs, virgin and reclaimed.
| Temp (°F) | Pressure (PSIG) |
|---|---|
| -20 | -1.8 |
| -10 | 1.9 |
| 0 | 6.5 |
| 10 | 11.9 |
| 20 | 18.4 |
| 30 | 26.1 |
| 40 | 35.0 |
| 50 | 45.4 |
| 60 | 57.4 |
| 70 | 71.1 |
| 80 | 86.7 |
| 90 | 104.3 |
| 100 | 124.2 |
| 110 | 146.4 |
| 120 | 171.2 |
Buy R-134a Refrigerant (page coming soon)
Negative values indicate a vacuum below atmospheric pressure. The interactive tool converts these to inches of mercury automatically.
R-404A Pressure-Temperature Chart
Walk-in coolers, freezers, and reach-in cases in commercial refrigeration are where R-404A shows up most, an HFC blend losing allowance under the same AIM Act phasedown schedule as every other high-GWP refrigerant. Reclaimed R-404A is becoming a bigger share of available supply as that allowance shrinks.
American Refrigerants stocks R-404A for commercial refrigeration accounts running walk-ins and reach-ins on a standing basis, not just one-off orders.
| Temp (°F) | Pressure (PSIG) |
|---|---|
| -20 | 16.8 |
| -10 | 24.6 |
| 0 | 33.7 |
| 10 | 44.3 |
| 20 | 56.6 |
| 30 | 70.7 |
| 40 | 86.9 |
| 50 | 105.3 |
| 60 | 126.0 |
| 70 | 149.3 |
| 80 | 175.4 |
| 90 | 204.5 |
| 100 | 236.8 |
| 110 | 272.5 |
| 120 | 312.1 |
Buy R-404A Refrigerant (page coming soon)
R-454B Pressure-Temperature Chart
New residential and light commercial AC systems built in the last two years are increasingly running R-454B, the A2L blend Chemours markets as Opteon XL41. Unlike the other four refrigerants on this page, R-454B carries a small temperature glide, about 2°F, so the chart below lists both bubble point and dew point rather than a single column.
American Refrigerants already stocks R-454B for the new-equipment jobs coming through right now, with same-day pickup available for local Bradenton and Sarasota County customers.
| Temp (°F) | Bubble Point (PSIG) | Dew Point (PSIG) |
|---|---|---|
| -20 | 24.3 | 22.6 |
| -10 | 33.9 | 31.8 |
| 0 | 45.3 | 42.7 |
| 10 | 58.5 | 55.5 |
| 20 | 73.9 | 70.3 |
| 30 | 91.7 | 87.4 |
| 40 | 112.0 | 107.0 |
| 50 | 135.0 | 129.3 |
| 60 | 161.1 | 154.6 |
| 70 | 190.5 | 183.1 |
| 80 | 223.4 | 215.2 |
| 90 | 260.0 | 251.0 |
| 100 | 300.8 | 290.9 |
| 110 | 345.9 | 335.2 |
| 120 | 395.7 | 384.3 |
More Refrigerants Are Coming to This Page
These five refrigerants cover the highest-volume PT chart searches, but they’re not the only ones American Refrigerants stocks. R-507A, R-11, and R-123 charts are next in line as the interactive tool expands, covering the centrifugal chiller and low-temperature commercial equipment this page doesn’t reach yet.
A Worked Example: Checking Superheat on an R-410A System
Say a suction gauge reads 118.8 PSIG on an R-410A system. The chart above shows that pressure corresponds to a 40°F saturation temperature. If a clamp thermometer on the suction line reads 55°F, superheat is 15°F, the difference between the two. Whether that number is correct depends on the metering device and outdoor conditions, but the chart lookup itself works the same way for any refrigerant and any pressure on this page.
Why This Runs as a Live Page, Not a PDF
Most PT charts online are scanned or exported as static PDFs, correct the day they were published and never touched again. This page is checked against current manufacturer saturation data once a year, corrected the same day if a manufacturer revises a published value, and built to be searched, bookmarked, and linked to directly, including a direct link to each individual refrigerant’s table.
Refrigerant PT Chart FAQ
What is a refrigerant PT chart?
A pressure-temperature chart lists the saturation pressure a refrigerant reaches at a given temperature, the core reference technicians use to check superheat, subcooling, and whether a system is holding the correct charge.
How do I use a PT chart to check superheat?
Read the suction line pressure, find the matching saturation temperature on the chart for that refrigerant, then subtract that number from the actual suction line temperature measured with a clamp thermometer. The difference is superheat.
How do I use a PT chart to check subcooling?
Read the liquid line pressure, find the matching saturation temperature on the chart, then subtract the actual liquid line temperature from that number. The difference is subcooling.
Why does R-454B have two pressure columns instead of one?
R-454B has a small temperature glide, so the liquid and vapor reach saturation at slightly different temperatures for the same pressure. Bubble point covers the liquid line, dew point covers the suction line.
Why is R-410A pressure so much higher than R-22 at the same temperature?
R-410A is a higher-pressure refrigerant by design, running roughly 50 to 70 percent higher than R-22 across most of the operating range, which is why equipment, gauges, and recovery tools built for one aren’t rated for the other.
How often are these charts updated?
Every chart on this page is checked against current manufacturer saturation data and published reference tables once a year, with the review date noted at the top of the page.
Can I cite or link to this page in training material or a trade publication?
Yes. These charts are built specifically to serve as a citable reference for industry publications, contractor training material, and technical coursework.
Do you sell or buy the refrigerants covered on this page?
Yes. American Refrigerants sells virgin and reclaimed refrigerant and buys back surplus cylinders across all five refrigerants listed here.
Need to Buy or Sell Any of These Refrigerants?
Pull a pressure reading off the chart, and if the job also means buying virgin refrigerant, selling recovered cylinders, or getting cylinders reclaimed to standard, that’s the rest of what American Refrigerants handles every day. Call (941) 371-0300 or request a quote online.